

In the 1990s, camel milk production remained relatively stable, starting at 830,000 tons in 1994 and reaching 840,000 tons by 2000. These levels reflect the challenges of the post-conflict era and the critical role of camel milk in Somali society.
After 2000, production saw notable growth, reaching 948,815 tons in 2005. However, a decline occurred in 2009, likely due to environmental factors such as drought. Despite this setback, production exceeded one million tons by 2010. Between 2010 and 2013, steady growth continued, peaking at 1,100,000 tons in 2013. This growth was likely driven by increased demand and improvements in herd management practices.
The number of camels in Somalia, a key factor in milk production, increased from 5.8 million in 1980 to 7.4 million in 2021. While there were minor fluctuations, such as a drop to 6.1 million in 1995, the population recovered to 7 million by 2000 and continued to grow consistently. By 2020 and 2021, the camel population reached its peak of 7.4 million.

Graph 1. Camels in Somalia by Number heads
FAOSTAT; 2022
displays Somalia’s camel milk production in tons from 1994 to 2022, highlighting the industry’s development amidst political and environmental challenges. Following the collapse of the central government in 1991, the sector operated without centralized support, relying on local resilience and traditional practices. Despite this, camel milk production gradually increased over the years.
From 2014 to 2022, production remained consistently high, ranging from 945,489 tons in 2014 to 987,842 tons in 2022. The gradual increases during this period indicate a recovery from earlier declines and reflect the industry’s resilience to challenges, including environmental variability.
Overall, the data underscores the importance of camel milk in Somalia’s economy and food security, showing how the sector adapted and thrived despite prolonged instability and recurring droughts.
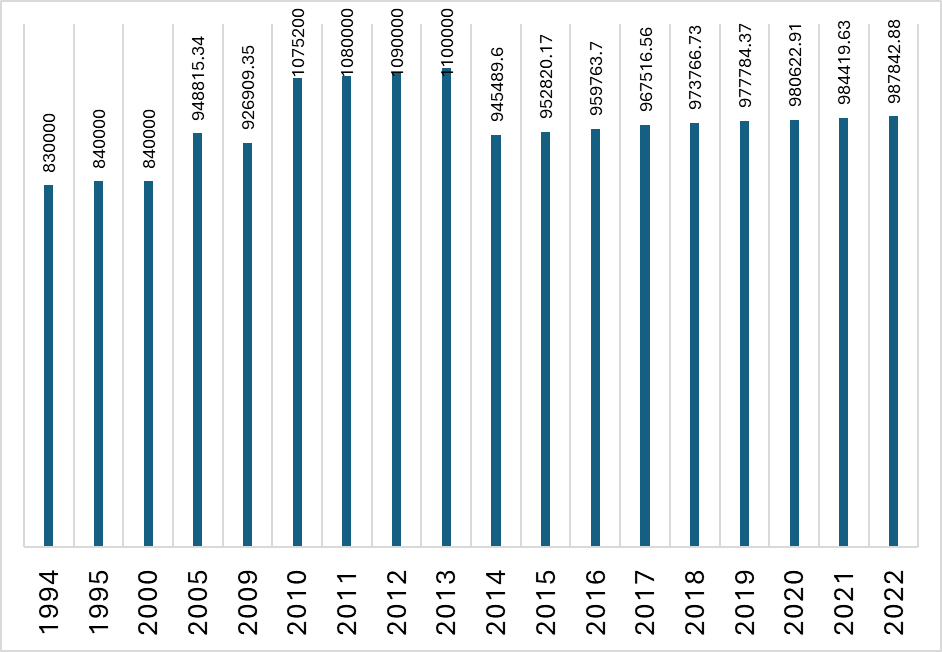
Graph 2. Camel milk production in Somalia.
Source: FAOSTAT 2023
Africa accounts for the largest portion, producing 71% of the total camel milk during this period. This dominance reflects Africa’s extensive camel populations, particularly in countries like Somalia, Sudan, and Kenya, where camel milk is a significant part of livelihoods and local economies.
Asia follows with 29% of the production, with contributions from countries such as Saudi Arabia, India, and Pakistan. These regions also have strong camel herding traditions, although their production levels are smaller compared to Africa due to differences in camel populations and land use.

Graph 3. Production share of milk of camel by region Average 1994 – 2022
Source: FAOSTAT 2023
Somalia emerges as the leading producer, with an average annual production of 934,517.95 tons, significantly surpassing other countries like Pakistan and Kenya. Despite decades of political instability, the collapse of central governance, and recurrent droughts, Somalia has maintained its position as the world’s top camel milk producer. This achievement underscores the resilience of Somali pastoralists and the importance of camel milk in the country’s economy and food security.
Other producers, such as Pakistan (812,083.33 tons) and Kenya (616,650.3 tons), also have notable contributions, but they operate under more stable conditions, making Somalia’s achievements even more remarkable. Countries like Mali, Ethiopia, and Saudi Arabia contribute significantly as well, though at lower levels compared to Somalia.
If Somalia were to achieve lasting peace and stability, the potential for growth in its camel milk industry and other sectors is immense. With improved infrastructure, technology, and market access, Somalia could not only strengthen its position as the global leader in camel milk production but also excel in other agricultural and trade sectors, solidifying its place among the top-performing nations in various industries. This data reflects both the current strengths and the untapped potential of Somalia.

Graph 4. Production of Raw milk of camel: top 10 producers Average 1994 – 2022
Source: FAOSTAT 2023
In 2018, export quantity was high at 70,000, paired with an export value of 37,000. A sharp decline occurred in 2019, with export quantity dropping to 2,699 and value to 750. Recovery was seen in 2020, where export quantity rose significantly to 55,577, and value increased to 18,830. However, 2021 showed another drop, with export quantity decreasing to 31,693 and value to 10,308. In 2022, both figures improved again, with export quantity reaching 43,600 and value rising to 14,600. The graph demonstrates fluctuations in export performance over the years.

Graph 5. Camle export and export value in Somalia
FAOSTAT; 2022
Reference
Nur, H. A.: 2005. Report on AnGR for Somaliland & Somalia. http://www.fao.org/3/a1250e/annexes/CountryReports/Somalia.pdf
United States Agency for International Development (USAID) Center for Resilience 2019. Studying the potential of camel leasing to increase resilience among Somali pastoralists October 03, 2019
FAO; 2023. Crops and livestock products. https://www.fao.org/faostat/en/#data/TCL/://www.fao.org/faostat/en/#data/QCL/visualize


